Wednesday, September 13, 2023

Solving slow Intel AX201 WiFi on Surface Pro 7 (and why Microsoft paid for support wasn't worth it for me)

TL;DR

It’s ToE on a Hyper-V vSwitch.  Go to the end for the fix.


The Long Version

After a series of upgrades (I’m not sure which ones) my Surface Pro 7, whilst working fine seemed to be rather slow when synchronising email/OneDrive/DropBox files.  To my surprise when I looked into it with SpeedTest my Wi-Fi connection was running at just over 1Mb download and a measly 0.1Mb upload.  No wonder!

To check the scope of the problem, I connected to other Wi-Fi networks (including a hotspot from my phone) and got the same result.   So I hauled out the Surface USB Ethernet Adapter and connected directly – all was good.  After hunting around online I found that I wasn’t the first to see this; and hardware was very much implicated (or rather hardware not recovering from sleep).  I tried various solutions suggested, and stopped using sleep mode (I tend to switch on, work, shutdown anyway).  To no avail.

So as I had a few years Business Warranty left I placed a tech support call.  And this had to be the worst technical support experience I’ve had with Microsoft ever.  I’m not sure it ever got to the right team in the weeks that followed.  It certainly never got to anyone who could propose a good fix, and I’m not sure that if I had had a hardware problem Microsoft would have even honoured the warranty I purchased (because I could find no route that seemed to invoke it).

I had already rebuilt the computer from scratch using the normal tools; but despite this I was pushed to do it again, but stay off the domain take logs and upload them.  This I did.  Microsoft never gave me feedback from the submitted logs.

However *good news alert* - as a virgin build the machine did have acceptable Wi-Fi performance again!

So time to bring my machine back to useful operation.  Which (as a major part of my working life) included recovering Hyper-V VM disks and rebuilding my test VM's.  At which point the problem recurred.

On a whim (as pretty much nothing else had touched networking), I deleted the VM’s and removed the Hyper-V vSwitch.  It worked!!  I was able to reliable reproduce the problem by creating and deleting the vSwitch and checking with SpeedTest. 

I thought this would be good news for Microsoft Support, and that they might be able to point me at something.  However, the Microsoft Support team to who I was talking said it wasn’t their issue anymore, and suggested I open a new ticket with the Hyper-V team and to open a ticket with them – I don’t get how they can just wash their hands and dump me to the back of the queue.  But it’s what they did.  Apparently support tickets cannot be moved between the teams.

Disappointed I turned back to the problem.  Knowing the vSwitch was implicated changed my attack and searched again.  I found these two articles online

Hyper-V Causes Extreme Degradation of Performance on WiFi Solved - Windows 10 Forums (tenforums.com)

Solved: Re: Hyper-V External Virtual Switch Bridge Mode - Slow download speeds on 8265AC - Intel Community

The latter of which lead me to

Network Optimizations - BizTalk Server | Microsoft Learn  - yes I KNOW it’s a BizTalk article – but trust me, lateral thinking and linking can really improve your fault diagnoses and fixes.

Which finally took me to a broken page link in this paragraph:


So I just BING’d the title of the article.   And got to Using Registry Values to Enable and Disable Task Offloading - Windows drivers | Microsoft Learn


Hallelujah!!!  Switching off Task Offloading on the network worked.  The steps to take are:

  1. Open Device Manager and locate “Microsoft Network Adapter multiplexor Driver”
  2. Right-click, Properties.
  3. Disable LSO settings 'Large Send Offload Version 2 (IPv4)' and 'Large Send Offload Version 2 (IPv6)', as shown in the following screenshot.


When they are disabled I got 75/18 MB out of an 80/20 internet connection.  When enabled that dropped to 1.5/0.1.


Postscript

I reported this back to Microsoft with the details thinking they’d be pleased.  They just replied with “We have escalated your support request to our colleagues in Windows/ Virtualization and Hyper-V unfortunately they are unable to assist thru our escalation. 

Please, contact them directly opening a new support request and choosing the support path from the screenshot below. “

Pathetic.


I’d asked Microsoft for answers to these questions – if you know the answers I’d like to hear from you, I don’t expect Microsoft will reply.

  • What is the Multiplexor Driver (used for NIC bonding) doing in the Hyper-V setup, and how does it fit into the overall networking picture?
  • Is this an AX201 specific bug (I have the same chip in Intel NUC machines here)?
  • Will this be resolved with a windows update that removes the performance penalty for setting ToE on, or default the ToE settings to disabled in a Hyper-V environment?


Wednesday, November 24, 2021

Update on COVID number methods

In the charts previously published I have written ICU, I've now realised that the government stats now report people on Mechanical Ventilators (which is not the same).

I don't know for sure if the measure was changed, but I'm pretty sure last year it was ICU - I just never noticed it change.

I'll not change the charts (too time consuming), but I will put a note at the top of the posts to this one to explain.

Thursday, November 18, 2021

Covid numbers again, after half term...

*Update - please see my post on ICU or Mechanical Ventilation for clarification of numbers shown

As ever, the raw data is taken from UK Government Stats and the numbers smoothed with a rolling 7 day average.


Overall Health Numbers (from positive tests to deaths)


Testing Numbers (performed and positive)


Testing volumes and the +ve test rate.


The new(ish) chart - an attempt to map the % transitioning from infection to hospital, to ICU and death with a time lag in the numbers


Wednesday, October 20, 2021

Covid numbers yet again (it's been a while)

*Update - please see my post on ICU or Mechanical Ventilation for clarification of numbers shown

As ever, the raw data is taken from UK Government Stats and the numbers smoothed with a rolling 7 day average.

Overall Health Numbers (from positive tests to deaths)


Testing Numbers (performed and positive)


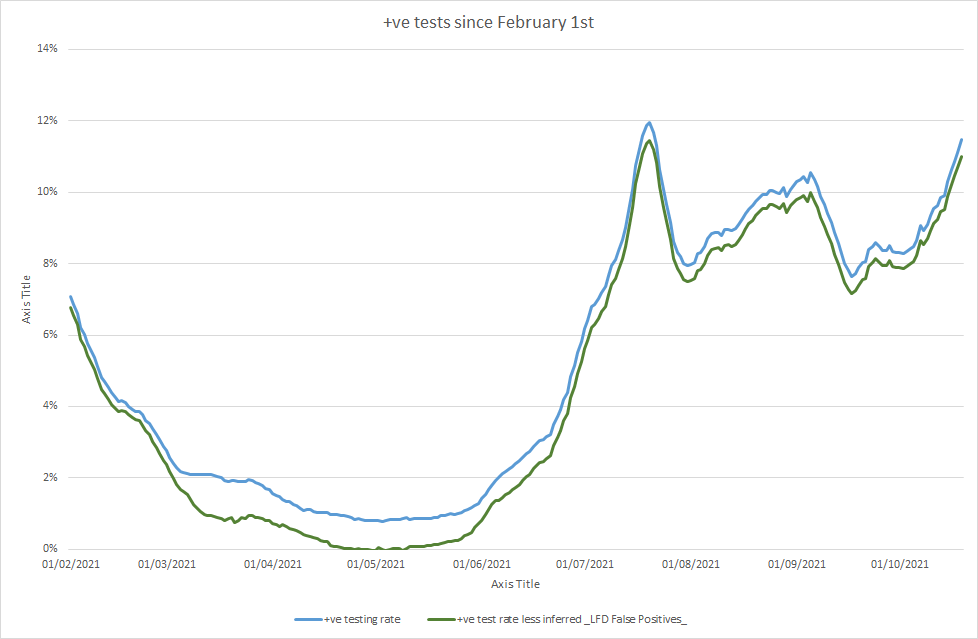
Positive testing rate (+ve tests against tests taken), with second line removing estimated (based on 0.32%) false positives on Lateral Flow Tests (LFT)


Positive test percentage since Feb 1st, 2021 *AND* positive test percentage allowing for a 0.32% false positive rate on LTF


Testing volumes and the +ve test rate.


And finally - a new chart - an attempt to map the % transitioning from infection to hospital, to ICU and death with a time lag in the numbers


Sunday, June 13, 2021

Covid Numbers to date (and a fifth graph!)

*Update - please see my post on ICU or Mechanical Ventilation for clarification of numbers shown

As ever, the raw data is taken from UK Government Stats and the numbers smoothed with a rolling 7 day average.

Overall Health Numbers (from positive tests to deaths)


Testing Numbers (performed and positive)


Positive testing rate (+ve tests against tests taken), with second line removing estimated (based on 0.32%) false positives on Lateral Flow Tests (LFT)


Positive test percentage since Feb 1st, 2021 *AND* positive test percentage allowing for a 0.32% false positive rate on LTF


And finally, testing volumes and the +ve test rate.


Wednesday, April 28, 2021

Covid Numbers to date

*Update - please see my post on ICU or Mechanical Ventilation for clarification of numbers shown

Raw data taken from UK Government Stats these are the numbers with a rolling 7 day average to smooth out the weekends


Overall Health Numbers (from positive tests to deaths)


Testing Numbers (performed and positive)


Testing Volumes


Wednesday, March 17, 2021

Covid Numbers (again)

*Update - please see my post on ICU or Mechanical Ventilation for clarification of numbers shown

Raw data taken from UK Government Stats these are the numbers with a rolling 7 day average to smooth out the weekends


Overall Health Numbers (from positive tests to deaths)


Testing Numbers (performed, and positive)


Testing Volumes


Thursday, November 12, 2020

Covid Numbers

I have an enquiring mind.  Which can be trouble.  Tired of unsatisfactory reporting in the various media open to me, I decided to have a look myself, and came up with these.  My data source was https://coronavirus.data.gov.uk/details/testing - you can go there and download your own data.  NB - the historical statistics change as information is updated, so you need to update more than just "today's" data to get an accurate image.

The first tracks the daily health stats (hospitalisation, ICU admissions and deaths) against the number of positive tests reported.  NOTE the red line is plotted against the right axis, all the others the left.
In red are the positive test numbers.  As you no doubt are very aware, a lot of government and media communication has been based on how many positive tests have been reported. Setting aside arguments about how many false positives there are, and the accuracy of the tests being used; there is a clear message in the this graph.  From about the beginning of September (when schools went back, and Universities started to go back) there has been a massive increase in positive tests, BUT the curves for admissions and ICU have matched it albeit less steeply.  For me this means whilst the focus on raw positive test numbers was inappropriate - it did indicate an underlying increase in transmission that led to ill health.  I think the language about tests means many infer that a positive test means someone is ill.  That is clearly not the case.

The other thing you can see is that the hospitalisation, ICU and death statistics were tracking the spring numbers to some degree when tiering and then lockdown 2 came.  It wasn't just positive test results that triggered government action.


The second chart plots just testing data - capacity, tests performed, and positive tests (with all the caveats above repeated on what is a "positive").  The red line is plotted against the right axis, the others the left.

For me the interesting data is whilst testing has grown in September and October, and grown a lot - the increase in positive tests has increased much than in proportion to testing.  Ignoring false positives, this shows that the infection (as measured by these tests) has dramatically increased in those months.


I have few other conclusions I want to draw or investigate.  But I'd add - I would to see false positives at least approximated in this data.


Thursday, September 24, 2020

Covid Risk Factors and mitigation - an update

In https://corylus.blogspot.com/2020/07/covid-risk-factors-and-face-coverings.html I set out a bunch of assumptions and numbers for the risk of meeting someone with Covid.

With the area numbers for positive cases here announced as 6.9 (the number top right in the spreadsheet) per 100,000 I decided to revise it.

Same premises/assumptions, new numbers


Saturday, July 11, 2020

Covid risk factors and face coverings


Before I discuss this, the attached image contains the overall spreadsheet and most assumptions are detailed on the page.  I don’t declare any infallibility (papal or otherwise), but if you think I’ve made a mistake contact me and I’ll upload a corrected version (if required).

I’m not drawing any specific conclusions on what our behaviour should now be, I did this to consider my own risk level for venturing out so that I could do so on a more scientific basis rather than gut reaction.

I used the following assumptions/default values:
  1. The infection rate is 1 person in 3,900 (the last one i saw)
  2. You need face to face exposure of 15 minutes to risk transmission of the infection
  3. Whilst the face covering mitigation %'s that have been circulating for some time are not proven, I have used heavily moderated values to explore the impact of face coverings
  4. I've ignored the risks (and maths) of meeting more than 1 carrier of C-19 in any one day
  5. I have ignored the fact that infection is not evenly distributed around the country, these numbers do not apply to hot spots.
  6. Equally, these numbers overestimate the risk in cold spots (if that is the opposite of hot spot!)
  7. This does not consider behaviour patterns whilst out – if you go to the pub and hug all your mates, then your risk likely increases – the behaviour assumed is that social distancing is observed.
  8. This ignores whether the exposure is indoors or outdoors
  9. The percentages shown don’t actually demonstrate the chance that you will get a C-19 infection, they show the risk of you participating in a face to face meeting where the risk of transmission can occur.  So given transmission is not certain, this means the risk % overstate the chance of you (on average) catching C-19 from that contact.
  10. Finally, even if the event does transmit C-19 to you, it says nothing about the risks of you falling ill (seriously or not) with C-19


The calculation in the second column is done from this logic:
  1. The risk of someone being infected is 1/3900 – call this X. In percentage terms this is 0.00000256410256
  2. The chance of any 1 person you meet being infection free is (1- X) which is 0.99999743589744 or 99. 999743589744%, call this Y
  3. The chance of all the people you meet being infection free is therefore the value in Y multiplied by itself once for each person, so for 10 people all to be infection free is Y*Y*Y*Y*Y*Y*Y*Y*Y*Y or Y^10.  Which is roughly 99.744%.
  4. Which means the probability of 1 or more people you meet being infect is 100%-99.744% which is my calculated 0.26%.


Image from calculation spreadsheet


Thursday, April 16, 2020

Advice on securing Zoom calls

a couple of friends have been worried about using Zoom.

This is the advice I'd seen and sent to them..

YMMV
 
Taken from https://twitter.com/FrameShiftLLC/  - How to stop harassment on public Zoom calls
 
Before meeting, host changes Zoom settings:
  1. Turn on "Waiting room"
  2. Turn off "Allow removed participants to re-join", "Allow private chat", "File transfer", "Annotation", "Whiteboard"
  3. Set "Screen sharing" to "Host only"
  4. Schedule a meeting in Zoom with a random ID (do not use Personal Meeting ID)
  5. Recommended: Do not share Zoom link publicly, instead make people register with email address and email them the Zoom link
 
During meeting:
  1. Host assigns "co-host" status to a trusted person
  2. Co-host admits people from waiting room, removes harassers, does not admit suspicious people
  3. Host transfers host status to people who need to share screen
  4. Optional: Lock the meeting after 5 min
 
If you do all these things, you will have a Zoom meeting with a defensible boundary that you can eject people from if they behave badly. It's the virtual equivalent of a well-run conference with registration, name tags, physical security, and code of conduct enforcement.
 
Links:


Wednesday, April 08, 2020

Images for a wiki page...

I updated the wiki page on crowdfunding, to correct some dates, and upload a couple of images.  But wiki rejected them.  So posting them here, and hoping I can connect to them here :-)


Monday, April 06, 2020

A free Power Apps app for the NHS (or anyone else fighting the C-19 war)

TL;DR - if you are 
a) combatting the C-19 pandemic
b) an Office 365 business or enterprise licence customer
c) want to know staff status, where they are working, and what they are doing;
then, I've this app that I'm able to deploy to your tenant pro-bono.

If you are not directly fighting C-19, but this app would do wonders for you, then I am willing to deploy it to you for a charitable donation to Help For Heroes.

YOU DONT NEED PREMIUM POWER APPS LICENCING FOR THIS

Installation can be done all remotely.

For data it uses standalone SharePoint lists, so there are no complex data setups.  It can be running in an hour or two.

Summary
I've worked with an NHS trust recently to create a Power Apps app for them.  They needed all staff to be able to self report in their status for 7 days (be that WFH, Ill, Self-Isolating, Covering a colleague or something else).  In under 24 hours we had a second version from which the screen shots below are taken.

As a bonus, the data that this app uses can be managed centrally from a Microsoft Access database which I shall also supply.

The below are just how the app finished at V2, there is no reason it cannot be easily and quickly modifed for your circumstances (for instance, you may only want a single status, rather than 1 per day).


Screen 1 - on opening the app you get:

  • a list of all your colleagues in your department and their status
  • the means to look at any other department
  • the means to look at all people in a particular status
  • the means to search for an individual
  • the means to edit your own status


Screen 2 - on opening the app you get to change your status across the current 7 days, by use of simple dropdowns on each day.  The list of entries is controlled by the company deploying.


Screen 3 - this is an optional extra - a quick display of your calendar so that you can quickly check without leaving the app


Tuesday, February 11, 2020

Thursday, April 11, 2019

Active Directory domain time settings (an unintended consequence of VMW - Hyper-V migration)

Over time my network had slipped a few minutes, but everything was synchronised, so there were no authentication problems.  However it was becoming more annoying (especially when email replies appeared to land a minute or two before the original was sent!).
 
So eventually I was persuaded to put time in to fix it, in the past I just fixed the clock on the master DC, and all was well.  However this time…
 
Everything I did had no effect, DC’s were changed to point to external NTP sources, but even with manual time changes at the command line they snapped back to the wrong time almost instantly.
 
Then something twigged.  My master time source DC was one of the last servers I moved off the old VMWare cluster into a new Hyper-V setup.  And of course Time Synchronisation from host to guest was on by default.  As soon as the DC changed time, Hyper-V tools snapped it right back.  And as the host took it’s time from AD, it was always out.  Before, when on vCentre, the host was synchronised to NTP servers, and the time sync worked.
 
This morning I unchecked time sync as below, reset the DC’s clock, and all was well.  I should have thought of this much earlier in the diagnostics.  But I guess having moved away from infrastructure and back to dev, my mindset has changed a bit!  These days I’m just a consumer of the network infrastructure (although I do have to be the admin too!).  I suppose I could have just changed the time on the Hyper-V host, but this is a better answer, as the NTP usage means the network should remain on the correct time.
 
TTFN


Wednesday, March 06, 2019

The case of the Nokia 8 and the missing fingerprint data...

A funny thing happened the other day.  I finally (and accidentally) let the phone fully run down to 0% battery.  But it when it was charged again, something odd – I couldn’t use the fingerprint reader to unlock the phone or for anything else.  On opening settings to investigate it even prompted me to register fingerprints.  It appeared to have lost all fingerprint data.
 
So I went to re-register the fingerprints I used before and was told to try another digit.  A quick BING search confirmed that this can happen, but curiously there wasn’t much I could find on sorting it out.
 
So, having tried all the digits I had previously registered I finally tried a new digit.  It worked and was registered correctly.  But I still couldn’t register or use the originals.
 
Ten minutes later, thinking laterally, I deleted the new print.  At which point the phone decided it didn’t know about of any of my prints and I could re-register the ones I normally use.
 
I don’t know if this is an Android 9 issue, a Nokia 8 issue, or the combination.  But as a heads up – leave at least one digit unregistered on your phone for when this happens to you!
 

Thursday, January 24, 2019

Telling the time

I remember being almost unable to breathe when this was first broadcast.  It’s still hilarious now.
 
“The first hand is the hour hand, the second hand is the minute hand, and the third hand is the second hand”


Tuesday, January 01, 2019

Desperate Remedies - a return to Victorian literature


A couple of weeks ago I resolved to return to the novels of Thomas Hardy.  As a Eng. Lit. ‘O’-Level student in the 70’s we’d covered a couple of his novels, and some poems; and I read most of them two or three decades ago.  A friend of mine (thanks Timbo!) posted The Darkling Thrush (https://en.wikipedia.org/wiki/The_Darkling_Thrush) on Facebook for the second time in a few years, and it seemed like time to move away from the diet of modern spy/crime/historical/fantasy fiction I’ve been reading for the past few years (e.g. CJ Sansom, Mick Herron, Robin Hobb, Ian Rankin, Stephen Donaldson, Peter James) and return to something from a different era.
I went for a kindle collection of all novels in publication date order.   So have started with Desperate Remedies from 1872 (https://en.wikipedia.org/wiki/Desperate_Remedies), although his second novel, the first was never published, so this is the correct starting point.
Hardy is noted for his lengthy, complex, punctuated sentence structure – and quite frankly it took a few chapters to get back into that style.  But after a few late night reading sessions (a hot bath for my spine is always a good place!!) I’m there and really enjoying it again.   The sentences just fall into place and the added bonus of reading on a kindle is the ability to highlight a word and get the dictionary definition (useful for writing that is nearly 200 years old).
The one thing I didn’t expect?  After all the excitement today of the New Horizons fly by of Ultima Thule (https://www.bbc.co.uk/news/science-environment-46729898) I didn’t expect to read those words in the novel.  I’ll let you read the novel to find out where and why.

Tuesday, August 07, 2018

If you see something like this. ITS A SCAM

I got an alert from Kaspersky that stopped me going to a site when I clicked on a music link.  Curious I decided to find out what was there.
 
It was this website, and is definitely not a Microsoft webpage, and definitely not a genuine issue.  If you get something like this then:
  1. Don’t do anything on that page, just close it and don’t answer any questions or enter any data until the page is gone
  2. Update or install AV software.  Any decent AV tool should have stopped you getting there
  3. Don’t panic!
 

Tuesday, July 31, 2018

Microsoft Forefront TMG and Windows 10 1803

With the 1803 update I got a problem.
 
I’ve used Forefront TMG2010 and it’s predecessors for over a decade.  It generally sits there doing it’s job and provides me with the means to control access in and out of the network.
The client has sat on the taskbar since XP days, without a problem.  Until the 1803 upgrade.
 
Microsoft don’t support TMG any more, so no joy looking on the forums for support, but I did find this: https://support.microsoft.com/en-us/help/936773/yellow-exclamation-mark-appears-next-to-the-firewall-client-icon-on-a.  Although I didn’t change the client (mine was v7.xxxx and 4 years younger), but the registry change had cleared the yellow marker on the TMG Taskbar icon.
 
I hadn’t found any actual problem with TMG (yet) that this might have caused, but at least an error has been cleared.